Billion FizzBuzz
484 seconds down to ~1.2, in Rust. Along the way: a benchmark harness that was lying to me, an optimization that made things worse on purpose, and a wall neither more threads nor more code could move.
FizzBuzz is useful here because it’s trivial: any slowness left over can’t hide behind “the algorithm is just hard.” The versions below come from actual commits, timed with std::time::Instant in release builds on this MacBook Air. n = 1,000,000,000 throughout.
Attempt 1: the version you’d write without thinking
One writeln! per line, no buffering:
for i in 1..=n {
    match (i % 3, i % 5) {
        (0, 0) => writeln!(out, "FizzBuzz")?,
        (0, _) => writeln!(out, "Fizz")?,
        (_, 0) => writeln!(out, "Buzz")?,
        _ => writeln!(out, "{i}")?,
    }
}
Piped to /dev/null: 484.442s. Formatting alone (writing to io::sink() instead of stdout, isolating compute from I/O): 7.463s. Real stdout is ~65x slower than compute-only.
That “isolate compute by writing to io::sink()” idea has a trap in it, which I didn’t see until it produced a number that couldn’t be real: 0.544 seconds, 1.8 billion operations/sec. io::Sink::write only reads buf.len(), never the bytes — so with nothing forcing the formatted output to matter, LLVM proved the whole loop had no observable effect and deleted it. Fixed by folding every written byte into a checksum before it hit the sink, forcing the work to actually happen. That fix mattered a second time, much later, in a way I didn’t expect — more on that below.
Attempt 2: stdout is lying about its own buffering
Stdout in Rust is documented as line-buffered “when connected to a terminal” — implying it isn’t, otherwise. It is, unconditionally, regardless of what it’s connected to. There’s an open standard-library issue about this and a PR that tried to fix it, closed without landing. So piped to /dev/null, attempt 1 was still flushing on every \n.
Two independent fixes: lock stdout() once instead of re-acquiring its mutex on every write! call, and wrap the locked handle in a BufWriter so the still-line-buffered Stdout underneath only gets invoked once per buffer-full instead of once per line.
14.640s — 33x faster. Bumping the buffer from the 8 KiB default to 1 MiB changed nothing (14.554s) — once the per-line syscall problem is gone, buffer size stops mattering.
Attempt 3: stop going through core::fmt for a string literal
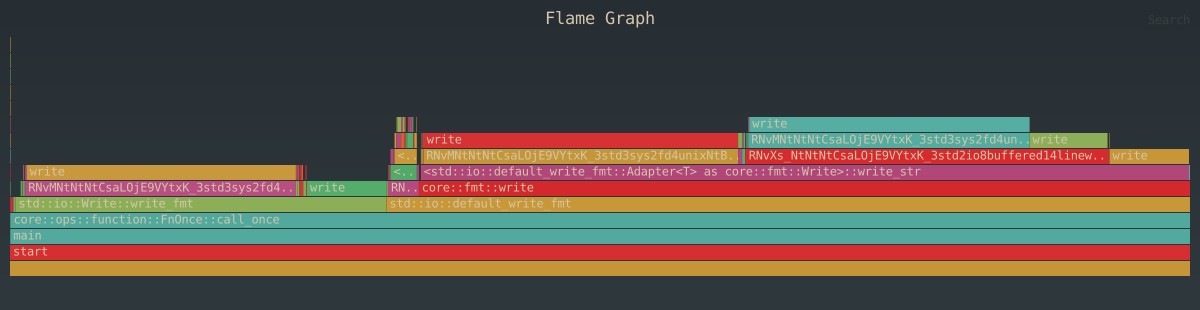
writeln!(out, "Fizz") routes a plain literal through the entire Arguments/Formatter machinery, same as a real format string. A flamegraph of attempt 2 showed ~58% of samples inside that machinery. Fix: write the constant branches as raw bytes, and use the itoa crate for the numeric branch instead of u64: Display — its own docs describe it as “the implementation from libcore, without the Formatter penalty.”
match (i % 3, i % 5) {
    (0, 0) => out.write_all(b"FizzBuzz\n")?,
    (0, _) => out.write_all(b"Fizz\n")?,
    (_, 0) => out.write_all(b"Buzz\n")?,
    _ => {
        out.write_all(buf.format(i).as_bytes())?;
        out.write_all(b"\n")?;
    }
}
Internally itoa converts two decimal digits at a time via a 200-byte lookup table instead of one digit per division. For this hot path, the table is the useful part: it gives the compiler a direct indexed load instead of asking it to lower a pile of cases into something equally cheap.
10.144s. core::fmt gone from the profile entirely.
That number was wrong, and not in a subtle way.
The checksum was costing more than the bug it was fixing
The Checksummed<W> wrapper from attempt 1 — the one that stopped the sink path from getting deleted — had been wrapping every write since, including real stdout. Real stdout writes can’t be dead-code-eliminated regardless of what wraps them; they have actual OS-visible side effects. So the checksum bought nothing there. It only cost time — a lot of it:
| with checksum | without | |
|---|---|---|
| real-stdout, 1B lines | 10.158s / 10.249s | 3.163s / 3.211s |
A ~3.2x tax, on the entire real-stdout path, the whole time. Far bigger than a flamegraph read predicted (Checksummed::write’s own frame only showed ~11% self-time) — the checksum’s checksum * 31 + byte is a serial dependency chain LLVM can’t auto-vectorize the way it vectorizes a plain memcpy, and LTO’s inlining had scattered its true cost across several profiler frames instead of one clean bucket.
Fix: correctness moved out of the timed binary entirely.
/// Stops the optimizer from proving the --quiet/sink path is dead,
/// without hashing every byte to do it.
struct Observed<W>(W);

impl<W: Write> Write for Observed<W> {
    fn write(&mut self, buf: &[u8]) -> io::Result<usize> {
        self.0.write(std::hint::black_box(buf))
    }
    fn flush(&mut self) -> io::Result<()> {
        self.0.flush()
    }
}
std::hint::black_box is the same near-zero-cost tool criterion uses internally — present purely to stop the optimizer from proving a loop is dead, buying no correctness guarantee on its own. Correctness became a cargo test: the same per-byte checksum, run once against a small fixed n = 10,000 and asserted against a pinned value — a one-time guarantee instead of a per-run tax.
Corrected attempt 3: 3.395s. Not 48x faster than attempt 1 — ~142x.

Attempt 4: a hypothesis, measured, and reverted
The corrected flamegraph put BufWriter’s own bookkeeping at ~26% of self-time — and every numeric line paid it twice, once for the digits and once for the trailing newline. Combine both into one local stack buffer, issue one write_all instead of two, halve the bookkeeping.
30–33% slower. itoa’s public API only hands back a &str into its own internal buffer; there’s no way to format directly into a caller-supplied one. So “one write instead of two” meant adding a copy_from_slice to remove a BufWriter call, and the added copy cost more than the removed call saved.
Reverted. Kept in the commit history anyway — a profiler-identified hotspot doesn’t mean every attack on it helps, and that’s as real a finding as any of the ones that worked.
A different question: forget stdout, use every core
stdout is inherently serial — a raw file descriptor has one shared kernel-side write position, so threads writing to it can’t preserve order without funneling through a lock, which defeats the point. But FizzBuzz’s output length is fully determined ahead of time. That means:
bytes(n) = Σ over digit-length buckets [10^(d−1), 10^d − 1] of: (multiples of 15) × 9 + (multiples of 3 only) × 5 + (multiples of 5 only) × 5 + (everything else) × (d + 1)
computed via floor-division within each bucket — at most 20 buckets for a u64, so this is O(digits in n), not O(n). The same formula gives any thread’s exact byte-range boundary.
Create the destination file, set_len() it to the exact computed size, mmap it mutably. Split the mapping into one &mut [u8] per thread at those precomputed boundaries — the borrow checker proves the slices don’t overlap, so nothing needs to be synchronized:
let mut remaining: &mut [u8] = &mut mmap[..];
let mut slices = Vec::with_capacity(boundaries.len());
for &(_, _, byte_start, byte_end) in &boundaries {
    let take = (byte_end - byte_start) as usize;
    let (head, rest) = remaining.split_at_mut(take);
    slices.push(head);
    remaining = rest;
}

thread::scope(|s| {
    for ((start_n, end_n, ..), slice) in boundaries.iter().copied().zip(slices) {
        s.spawn(move || write_chunk(slice, start_n, end_n));
    }
});
Each thread formats its assigned numbers directly into its own memory. No locks anywhere in this function — none are needed.
First full run, 1B lines (7.87 GB): 65.560s. Then a second identical run didn’t finish in 6.5 minutes before I killed it. Both far worse than attempt 4’s single-threaded 3.4s, on 8 cores.
Splitting the timing into compute and flush found it: at n = 500,000,000 (3.9 GB), compute alone took 9.862s — a ~14x blowup from n = 200,000,000’s 0.271s, for only a 2.5x increase in data. The slowdown was inside compute, not the final flush(). Past some threshold on this machine, between 1.5 GB and 3.9 GB, macOS’s virtual memory system starts synchronously throttling writes into mmap’d memory to force writeback, before any explicit flush ever runs. Writing into mapped memory, past that point, is disk I/O — a wall single-threaded stdout-to-/dev/null never hits, because /dev/null never persists a byte.
Isolated with an anonymous mapping instead of a real file — real memory, no backing storage, nothing ever written to disk:
| destination | 1B lines |
|---|---|
| real file | unreliable — 65s, then 6.5+ min, killed |
| anonymous memory | 1.140s / 1.199s / 1.833s |
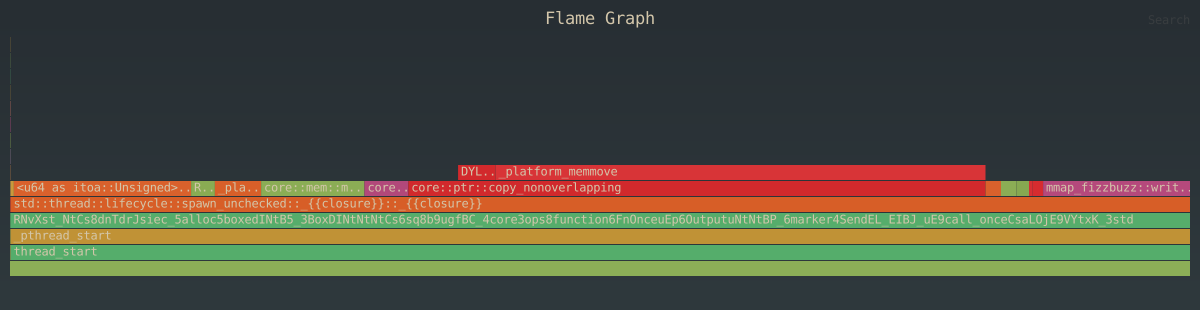
The fastest number in the project, and the flamegraph says exactly why it’s not faster still: 45.4% of self-time is _platform_memmove, across all 8 threads combined — the largest bucket by a wide margin. Only ~1.2–1.9x over the single-threaded compute-only number, not 8x. This workload is memory-bandwidth-bound: the per-byte work is cheap enough that 8 threads mostly contend for the same shared bandwidth rather than each getting an independent core’s worth of throughput.
Where this actually stops
Two ceilings are doing the real stopping here: how fast this machine’s memory can move bytes, and how fast its SSD can absorb them once its write cache is exhausted. Everything that worked before this point was closing a gap between the algorithm and the hardware. Attempt 4 already showed what happens when I kept pushing past that: a reasonable-sounding change, measured, wrong.
Open question
Product changes the spec: divisors need to be configurable, not 3 and 5. i % 3 is a compile-time constant today, so LLVM silently turns it into a multiply-shift instead of real division. The moment it’s a runtime value, that optimization disappears, and division gets expensive again — for free, without anyone noticing why. Next: Return of the FizzBuzz, Attack of the Product Managers.